BetterEvaluation FAQ: How can you get stakeholders to articulate how they think a program or project works?
In our last newsletter we drew attention to our method page on Articulating Mental Models (part of the Develop program theory or logic model task), and asked the BetterEvaluation community:
How do you go about getting stakeholders to articulate how they think a program or project works?
Longtime BE member, Rosemary Cairns, sent us a beautiful email in response, outlining two examples of using maps to help draw out connections during interviews. With her permission, we're delighted to be able to share it with you. Thank you, Rosemary. If you have any experiences from your own practice that you'd like to share, please contact us with your examples.
Your question brought to mind two stories, one in Sudan and one in Southern Sudan.
The price of staples
In one case, I was asking questions of a wonderful older man who, through his work in agricultural extension, had gotten to know the communities in his area well. One of the effects of conflict was that people were not cultivating crops as they used to: they were afraid to go into the fields for fear of being attacked.
He had decided, starting with his relatives and friends, to build peace in his own community, and he had done so with such success that people were once again cultivating crops - helping to reduce hunger, and also (not coincidentally) bringing down the price of the two staple foods, millet and sorghum.
A neighbouring village, hearing of his success as a peacebuilder, asked him to help them as well.
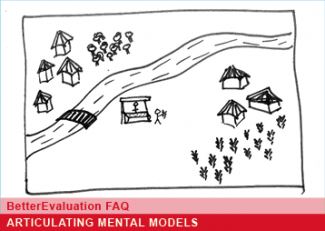
It was in terms of evaluating the peacebuilding that I was speaking with him, but I was finding it difficult to visualize where the villages were. So I asked him to draw the local map, with the two villages, on a piece of flip chart paper.
It was as we were standing in front of the flip chart that he began to talk about the price of the two staples (because he was drawing where people cultivated as part of the map). He explained that the prices of those staples had gone down because of peace, and that consequently, it was less expensive for those who weren't growing their own crops as well to buy staple foods for their families.
As I said, this insight - and the possibilities for recreating the market which once linked the two communities, and attracted people from farther away, thus creating economic growth that would help to sustain the peace they had helped build - came because I asked him to draw the villages on a map. (Not to mention that it provided an idea for a quantifiable indicator of peace - the relative prices of these two staple crops.)
Re-establishing community values
The other story is from South Sudan. I was evaluating a project that involved a group of people who had been travelling around a remote area to encourage people to be peaceful in the lead up to the referendum on South Sudan's independence.
Sitting around a table in a hotel in Juba, I sensed that the men were (a) bored with my questions or (b) trying to answer what they thought I wanted to hear. The conversation wasn't going anywhere, in terms of what I needed to know.
So I asked them to draw the area where they had been working as mobilizers. As they stood in front of the flip chart paper maps, they told stories about their work in various communities and the challenges of travel, which provided social and cultural insights that never would have emerged otherwise.
We sat back down again, and I told them the story of the man from Sudan and how his peacebuilding efforts had reduced millet prices, and that got them going on how they knew that their work had been successful.
In some small communities, they said, people once again had begun to either protect cattle that had wandered into their area and/or to find out who the cattle belonged to and return them. This is how people were in the past, before war, they said. Sometimes the cattle stayed so long that when the owner came to get them, he got additional calves that had been born since the cows had wandered into the area - but people had looked after them as if they were their own.
This behaviour had broken down during the years of conflict, when the 'white army' - the young men who herded their family's cattle to grazing areas during the dry season - were pulled into conflict and learned that a gun could bring them things they could not get any other way.
I remember another story they told me, of how they worked to change people's behaviour.
Sometimes when crates of soda were being delivered to a small store in the community, these young men with guns would hijack it and steal sodas. The mobilizers said to them, if you want a soda, you can sell cattle and get money to buy it - you don't need to steal it.
This most basic kind of helping to re-establish community values that had been devastated by years of conflict was part of their work as mobilizers - much more so than the numbers of meetings they held or the number of people who attended, which was the key quantitative information I had been given.
Maps and stories as a tool
These kinds of behaviour changes - and these stories - are not easy to elicit in a formal evaluation interview, normally.
I believe it was because I asked them to draw the areas where they had worked, and then asked them to talk about the maps as we stood in front of them, that created a level of trust so they shared what they might otherwise have thought were stories that were not important for me to hear. (Also because I shared a story that seemed relevant, which in effect validated the kind of qualitative work they were doing.)
In both cases, I believe that asking them to draw the areas changed the balance of power in our relationship. While I was the evaluator, they were the experts on the area, communities and people. So we communicated on terms of equality - horizontally, as CDRA puts it - expert to expert, rather than 'vertically' - expert and non-expert. This markedly changes the tone of the conversation, I think.
So I would encourage evaluators to consider taking a more 'graphic' approach in terms of asking people about their theory of change.
I am a facilitator, so I carry markers with me and have paper available to me, but you don't have to be a facilitator to ask a person to draw a map - you just need a few markers. Even where there isn't flip chart paper and a marker, people can draw in the dust with sticks and place stones to show communities or significant places.
The key, for me, is that it balances out the expertise and thus encourages people to share from their experience in a way they might not otherwise do if I was asking them to comment on the 'indicators' in a matrix.
Related content
'BetterEvaluation FAQ: How can you get stakeholders to articulate how they think a program or project works?' is referenced in:
Blog
Page