Causal mapping helps make sense of the causal claims (about "what causes what") that people make in interviews, conversations, and documents. This data is coded, combined, and displayed in the form of maps. These maps show individuals' and groups' mental models and can support further investigation of causal connections.
Causal mapping is designed for the analysis and visualisation of qualitative data about causal links. It can be used to test an existing theory of change or create collective empirical theories of change about how a program works based on stakeholders’ experiences.
People’s narratives and reflections about their experiences provide qualitative data that can be coded and displayed as maps to present the cognitive structures (mental models) of individuals and groups and to support further exploration to understand actual causal connections.
These causal maps can help to answer questions about what people think happened and what they think caused this by building links between different factors, such as different kinds of outcomes and inputs. Mapping the chains of results and their linkages builds pictures of causal pathways showing the intermediate steps and connections between them.
Causal mapping distinguishes carefully between evidence for a causal link and the causal link itself. It does not provide any specific way to make causal inferences from one to the other. Causal mapping can help the evaluator to identify, code, simplify and synthesise the evidence for causal connections, but the evaluative step to make a judgement about whether one thing in fact causally influences another is left to the evaluator. This method is not useful if each piece of evidence is not clearly identified with a source.
Examples
As explained on the Causal Mapping website:
"A global causal map resulting from a research project can contain a large number of links and causal factors. By applying filters and other algorithms, a causal map can be queried in different ways to answer different questions, for example to simplify it, to trace specific causal paths, to identify significantly different sub-maps for different groups of sources, etc. With certain assumptions, it is possible to ask and answer questions like 'which is the largest influence' or 'which is the most positive effect'."
The figure below shows a map from the application Causal Map, showing coded causal statements for a project that provided farmers with agricultural training and advice in order to increase crop yields. The map has been filtered to show only outcomes downstream of the influence factor ‘Agricultural training and advice’. Numbers shown indicate how many times the links were made across all interviews.
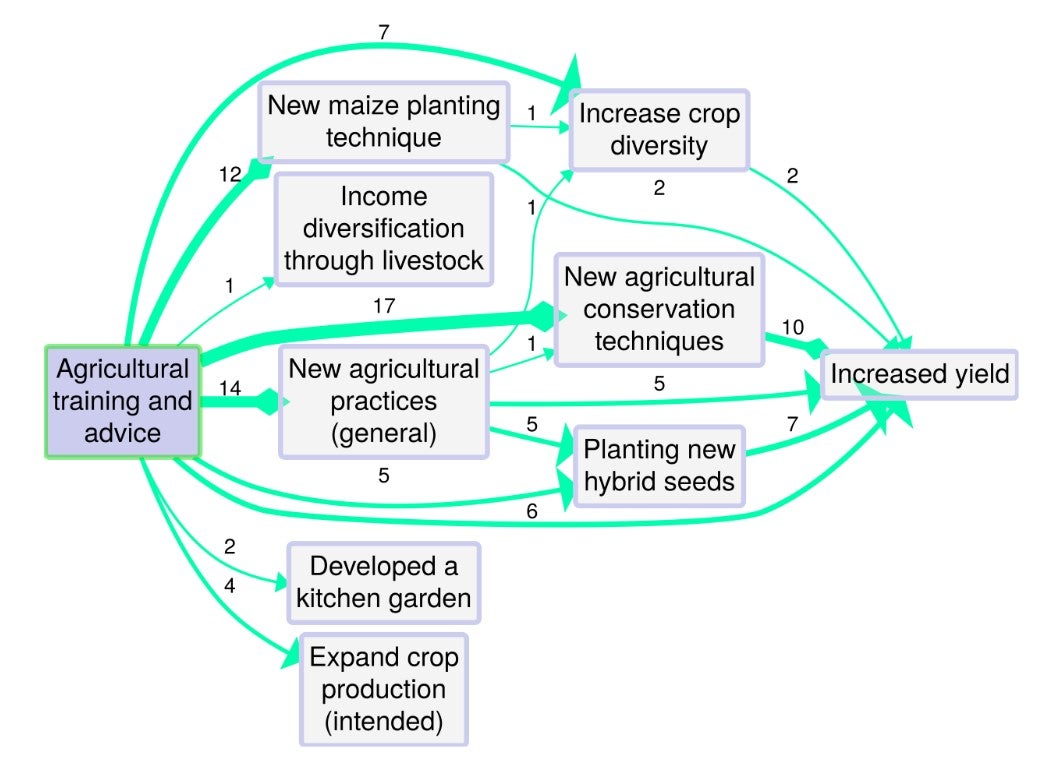
Source: BDSR, 2021, p 4
Advice for choosing this method
Causal mapping is useful when seeking to understand the causal pathways influencing the outcomes of programs operating in complex settings. It helps make sense of a program and its context in stakeholders’ own words. This includes providing ways to make sense of and organise the different, but sometimes overlapping, labels that different groups use to describe the causal factors that are important to them.
Causal mapping is particularly useful for evaluations that focus on learning to inform program improvement as visual representation of causal links between context, activities and outcomes can help to facilitate the sharing and collaborative use of findings.
Causal mapping can be used during a program lifespan to inform adaptive management and as part of a final evaluation.
Causal mapping can be used to help make sense of large amounts of qualitative data.
Using this method requires expertise in coding and analysis of qualitative data.
Causal mapping is less frequently used to analyse quantitative data or to do precise mathematical modelling, e.g. of future states of a system under certain conditions.
Advice for using this method
Care should be taken to ensure that findings are accurately described – consider the implications of sampling decisions and data collection processes when presenting results.
Resources
Tools
- List of causal mapping software
This Wikipedia page provides a list of software applications that can be used for causal mapping.
Overview
- What is causal mapping?
This is a one-page introduction to causal mapping.
Websites
Discussion Papers
- Causal mapping for evaluators
This article provides a background and detailed description of the use of causal mapping in evaluation.
Guides
- Decision Explorer® user's guide (PDF)
Decision Explorer provides a causal mapping framework that helps to facilitate decision making. The software allows the user to work with a model of inter-linked ideas using maps. Trial version available.
- Comparative Causal Mapping: The CMAP3 Method
An introduction to the conceptual backgrounds of causal (cognitive) mapping and to the typical methods in comparative and composite causal mapping, based on either interview or questionnaire primary data or on secondary documentary data. The research is supported by CMAP3, a freely downloadable Windows software platform for causal mapping.
Sources
BSDR. (2021). From narrative text to causal maps: QuIP analysis and visualisation. Bath Social & Developmental Research Ltd. Retrieved from: https://bathsdr.org/wp-content/uploads/2021/10/From-narrative-text-to-causal-maps-QuIP-analysis-and-visualisation.pdf
Expand to view all resources related to 'Causal mapping'
'Causal mapping' is referenced in:
Approach
Blog
Framework/Guide
- Rainbow Framework :
Theme